Bearing AI: Designing schedule recovery intelligence
Maritime • Sustainability • Web App
Bearing AI is a maritime technology company focused on applying machine learning to improve fleet operations. With a platform rooted in AI-based fuel optimization, route planning, and emissions reduction, Bearing AI helps shipping companies make smarter, faster decisions across their global operations.


Role
Role
Product Designer
Team
Team
Product Designer, Product Manager, Head of Product, Engineers (3), QA Engineer
Tools
Tools
Airtable, FigJam, Figma
GoToMeeting, Dovetail,
Google Forms, Notion
Timeline
Timeline
12 weeks
Challenge
Shipping schedules are inherently dynamic, disruptions caused by port congestion, weather, or operational delays lead to increased costs, missed deadlines, and cascading downstream effects. Vessel operators must balance fuel costs, emissions, berthing windows, and commercial trade-offs under tight time constraints. The challenge was to design an MVP that empowered vessel operators to:
Quickly generate viable recovery scenarios
Compare cost, emissions, and scheduling trade-offs
Collaborate across teams without switching tools
Results
Launched a 0→1 MVP tool for schedule recovery used by vessel operators to reduce delay-related costs.
Enabled scenario-based recovery planning, driving better decisions around speed, port calls, and fuel usage.
Established a foundation for a scalable, AI-powered recovery system within Bearing’s suite of operational tools.
90%
TASK SUCCESS RATE
TASK SUCCESS RATE
TASK SUCCESS RATE
-20%
LOWER COSTS PER VOYAGE
LOWER COSTS PER VOYAGE
LOWER COSTS PER VOYAGE
+10%
INCREASE IN SCHEDULE RELIABILITY
INCREASE IN SCHEDULE RELIABILITY
INCREASE IN SCHEDULE RELIABILITY


Context: The Liner Shipping Opportunity
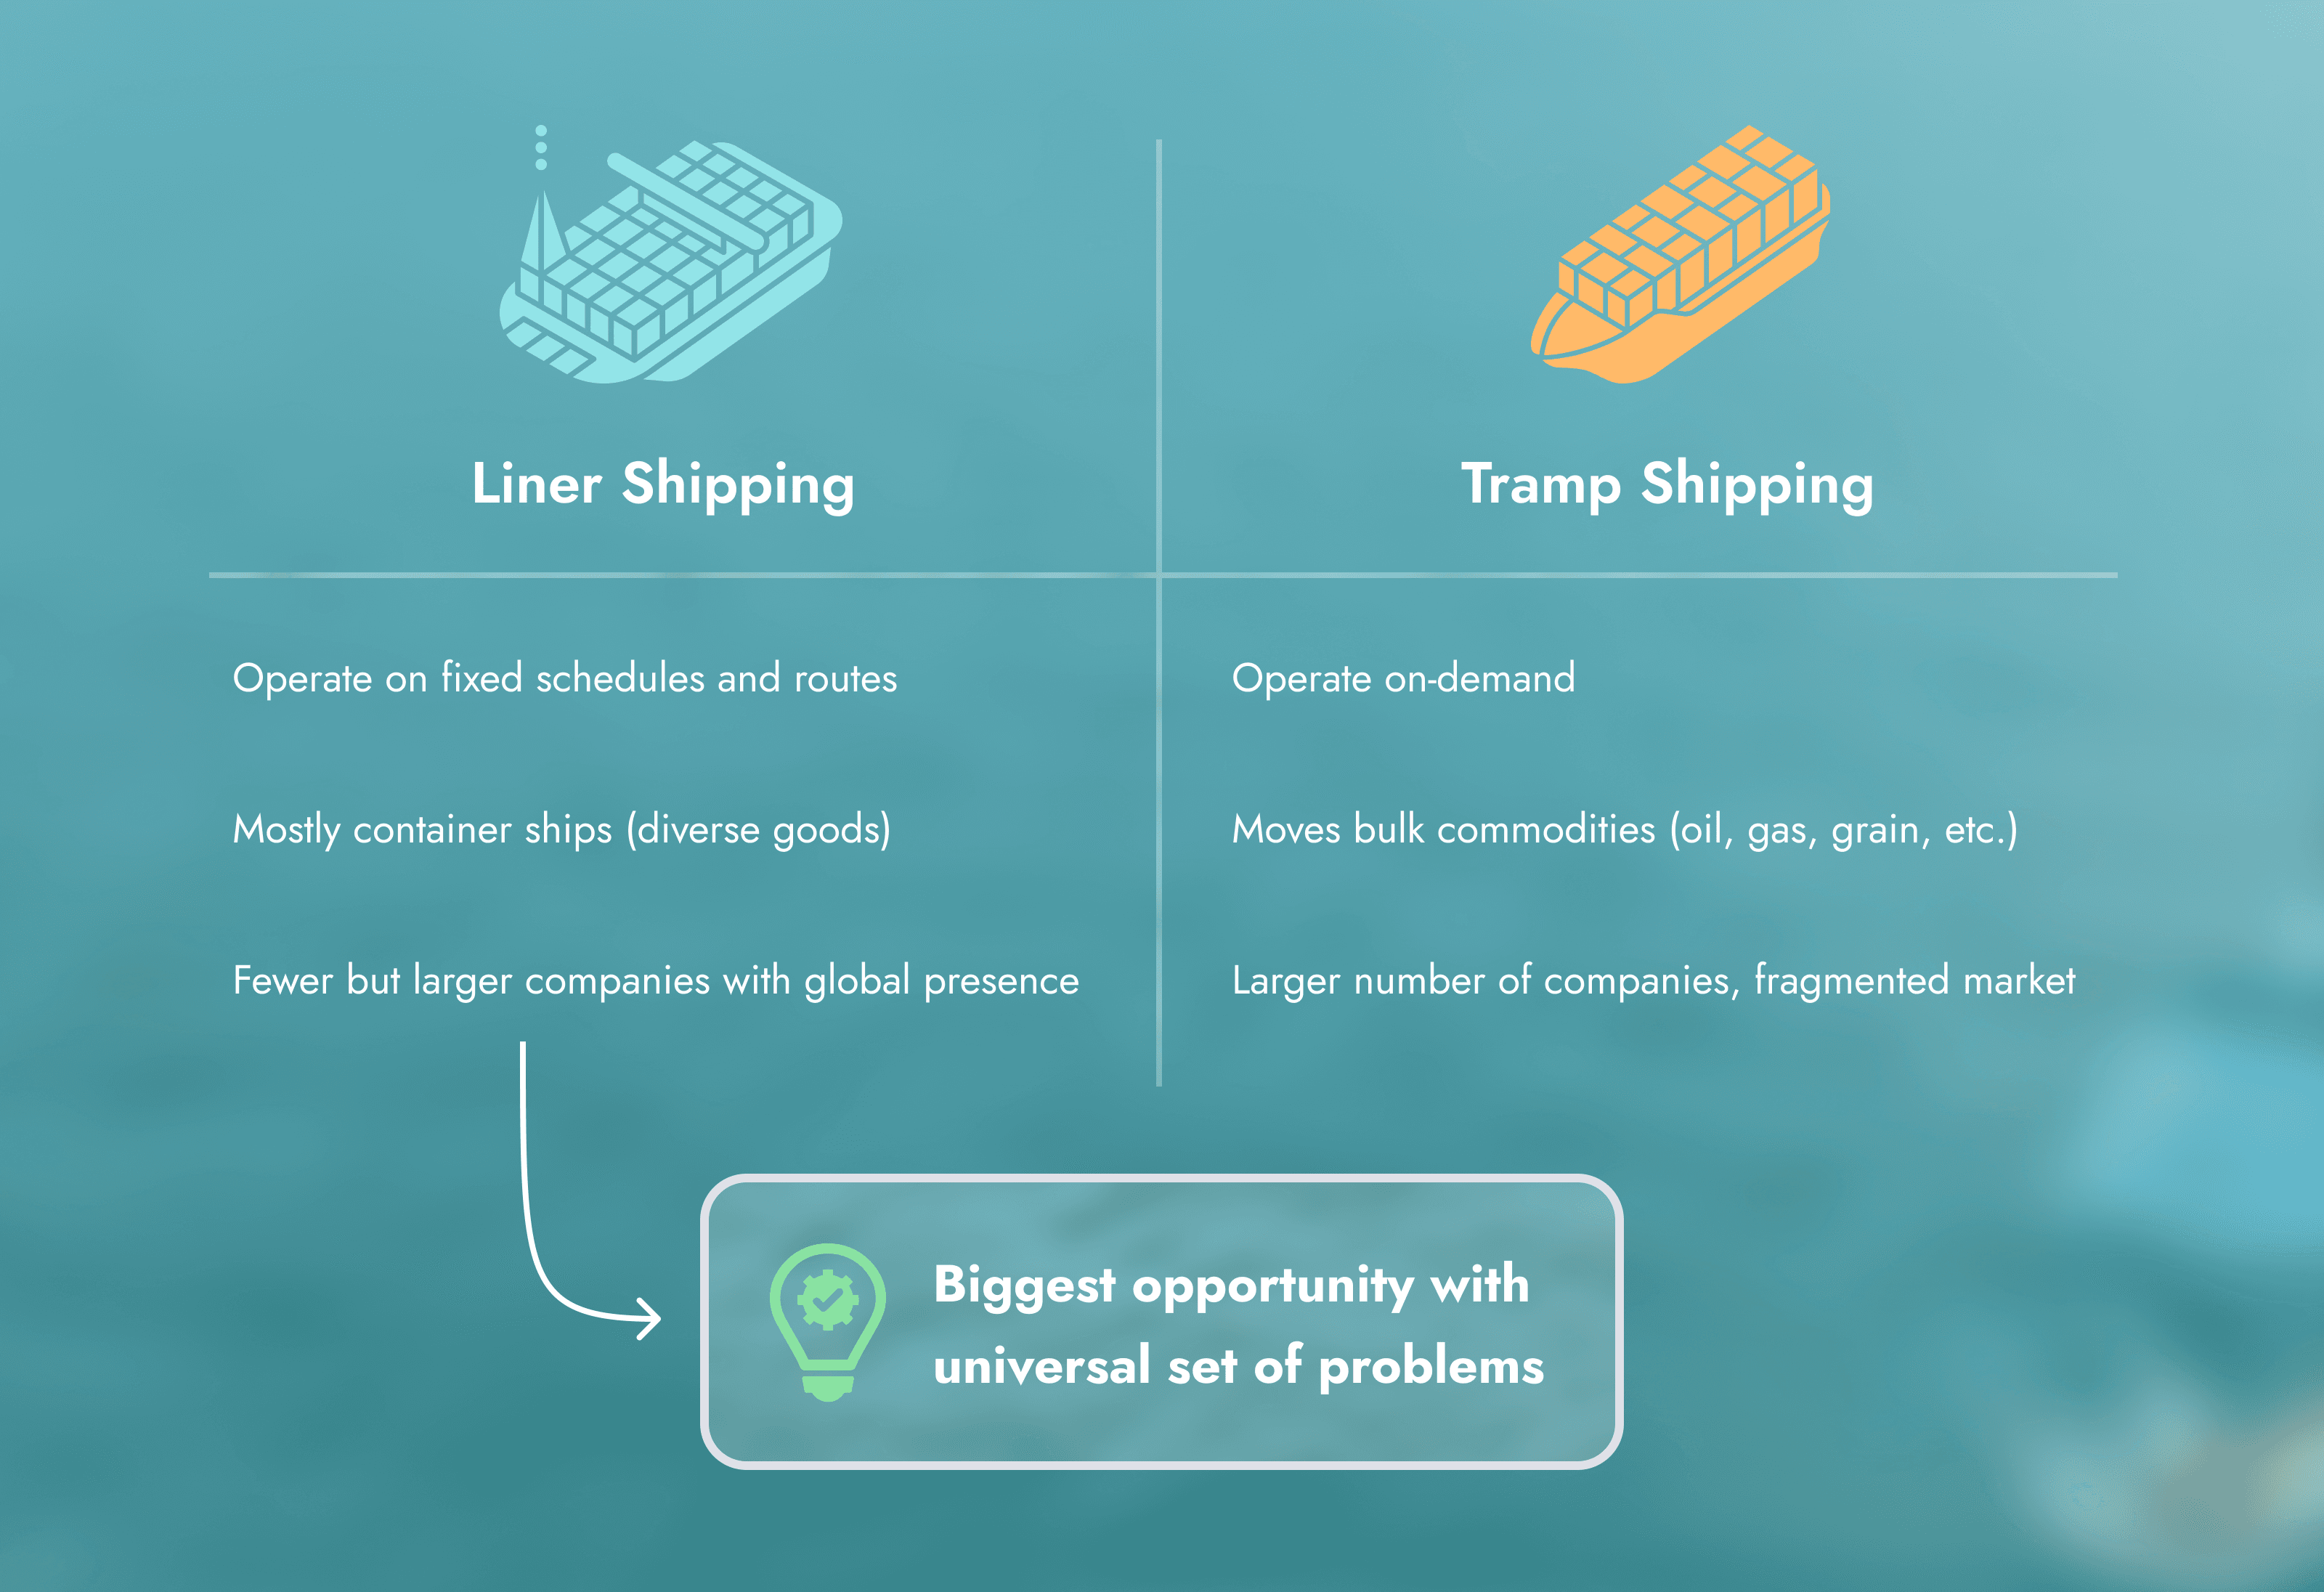
Unlike tramp shipping, where vessels operate on-demand, liner shipping operates on fixed schedules, serving consistent routes for global trade. Due to its logistical complexity and asset intensity, there are fewer liner companies worldwide, which makes each one a high-value customer.
At Bearing AI, some of our largest clients were liner operators, but we often found ourselves reactively building one-off features in response to customer requests, rather than solving universal pain points. This reactive approach made it harder to scale and retain contracts with major players.
When a new Head of Product joined the team, we revisited our strategy. Through renewed customer engagement and strategic research, we uncovered a recurring challenge shared across the industry: Schedule Recovery. This case study details how we translated that insight into a focused, user-driven MVP.


Uncovering the Problem
The Product Team planned an offsite to kickoff an in-depth discovery sprint to understand our users, their workflows, and key pain points within the liner space. Prior to meeting, we set off to talk with as many possible stakeholders from various liner companies.
Persona Interviews
We interviewed over 25 stakeholders with an emphasis on vessel operators, operations teams, and fleet managers across global shipping companies. Some of the questions we asked:
“ What are your role responsibilities and KPIs?"
“What does a typical disruption look like?”
“What are your most urgent and frequent tasks?”
Jobs Matrix
From our interviews, we mapped user job responsibilities by frequency, urgency, and value, identifying the most impactful job clusters across liner shipping organizations. As we regrouped at the offsite, we had discussions around the prioritization of these jobs and where we could the most value in which problems to solve. From a comprehensive job analysis across maritime roles, we identified the highest-frequency and highest-impact responsibilities tied to schedule reliability and recovery.


Schedule Recovery & Schedule Reliability
Vessel operators, in particular handle schedule recovery and are responsible for:
Handling service schedule disruptions
Optimizing routes between ports under time and cost pressure
Communicating delays and adjusting schedules
Coordinating bunker scheduling, port windows, and compliance
Schedule reliability is the consistency at which vessels arrive at their scheduled ports in time, usually calculated as a percentage. It is one of the top KPIs for liner operators (usually with a 90% target rate) and dependent on the execution of schedule recovery.


Understanding the Problem
How Users Are Solving This Today
After our offsite, we took a deeper dive into our previous Liner interviews and employed another round of interviews with 3 more operators. Based off our interviews, we wanted to understand how users were solving this problem today. Operators relied on:

Noon Reports
Spreadsheets to manually calculate ETA impacts and fuel costs

Gut Decisions
Using experience to handle disruptions vs. data-driven decisions

Manual Port Coordination
Calling terminals to renegotiate berthing windows

Single-Scenario Planning
No ability to compare cost and schedule tradeoffs between multiple recovery options
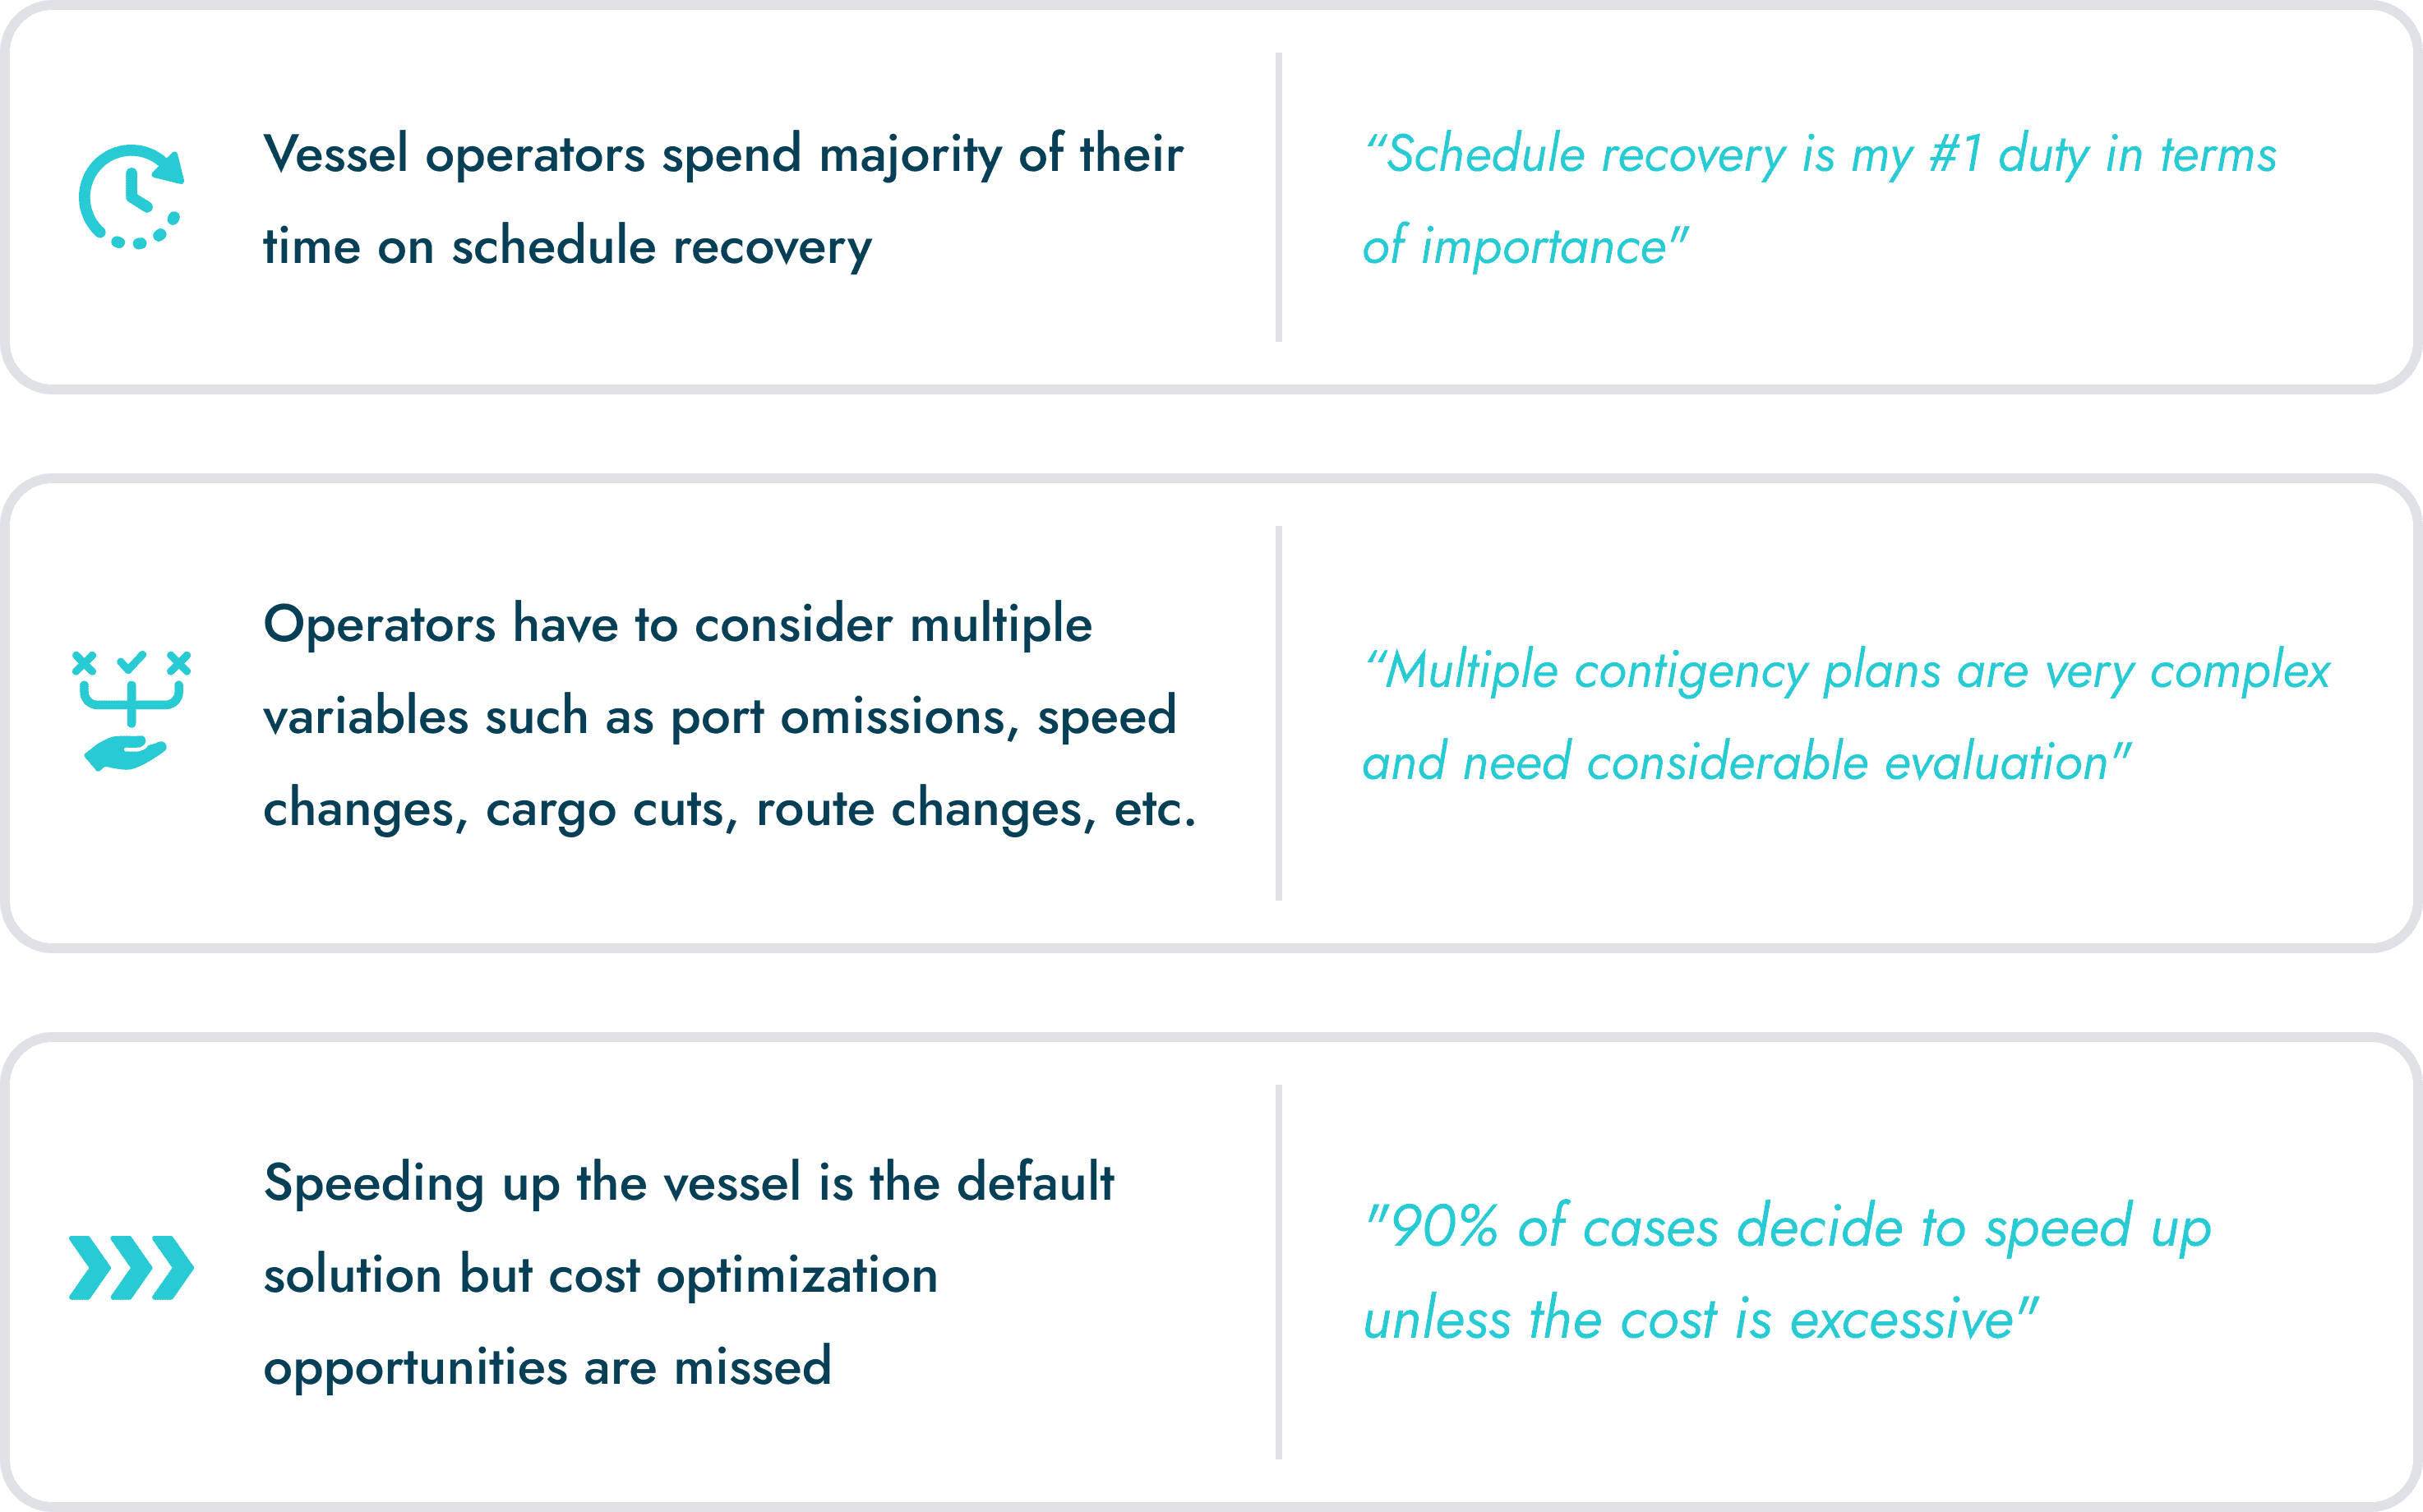
Vessel Operators spend majority of their time on schedule recovery


Operators have to consider multiple variables such as port omissions, speed changes, cargo cuts, route changes, etc.


Speeding up the vessel is the default solution but cost optimization opportunities are missed
"90% of cases decide to speed up unless the cost is excessive"
“Multiple contigency plans are very complex and need considerable evaluation"
“Schedule recovery is my #1 duty in terms of importance"
Key Findings
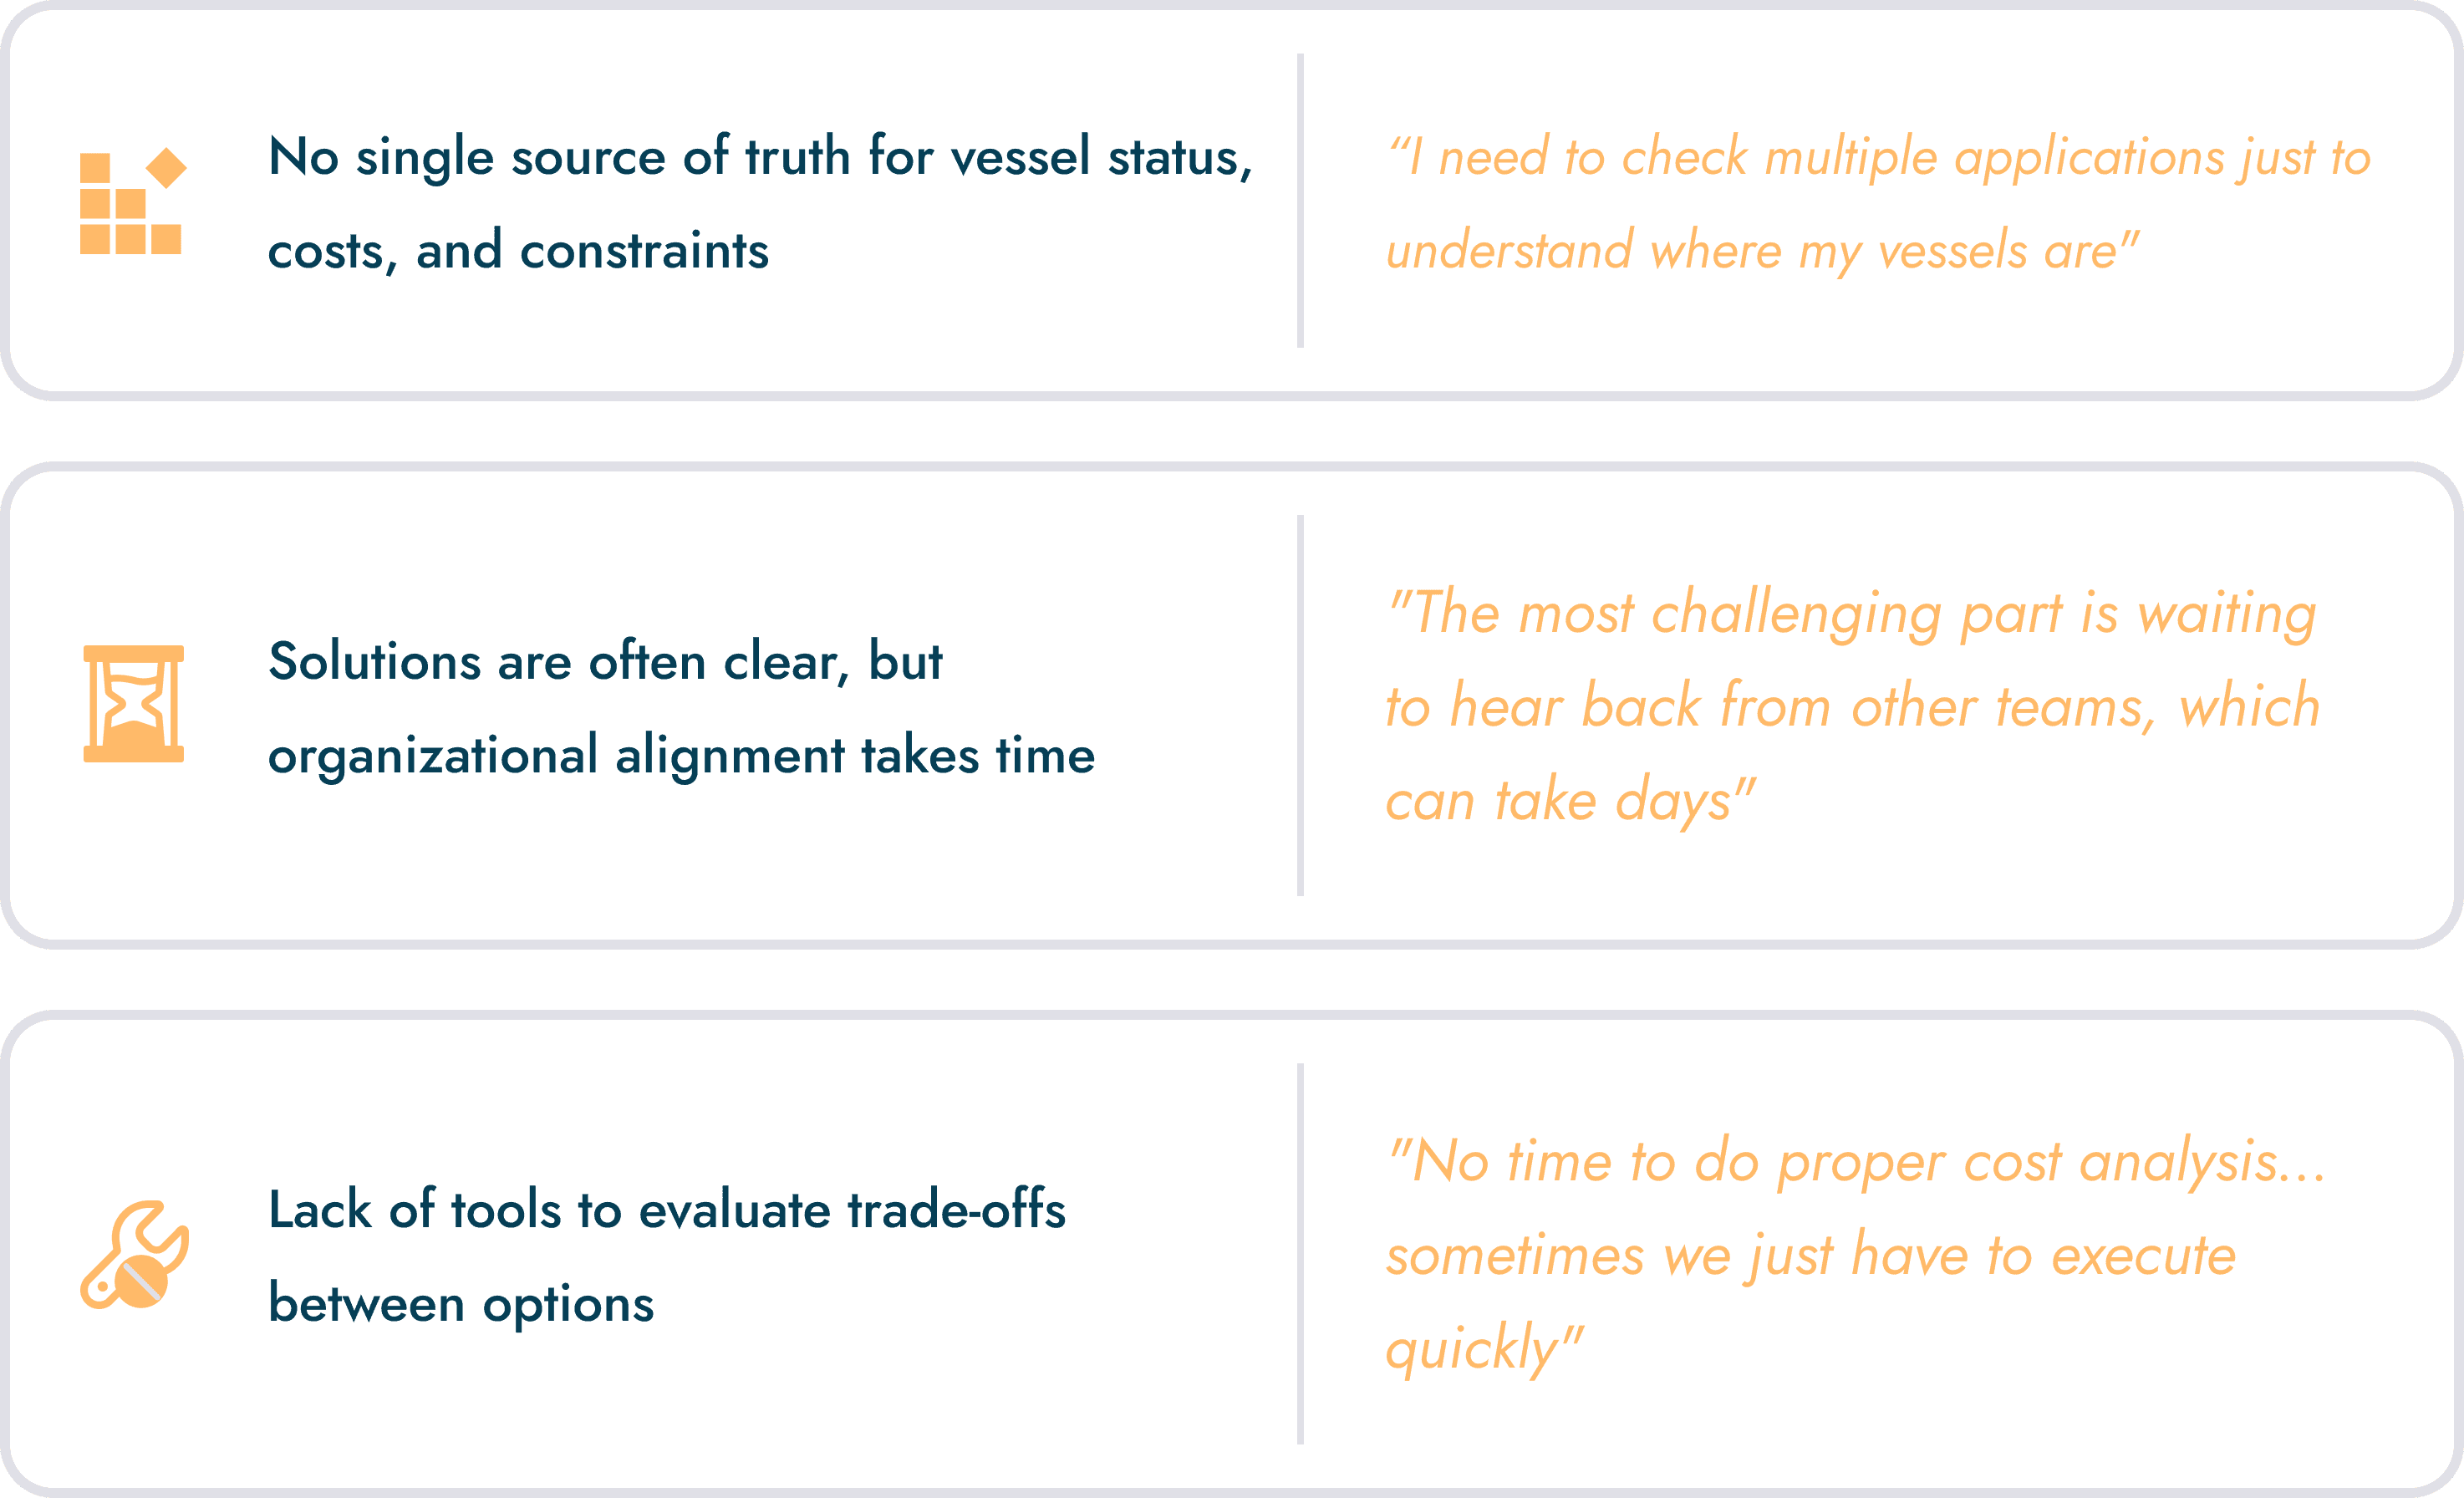
Below are the top themes that came up when talking to operators and quotes to support the daily and weekly insights into their roles.


No single source of truth for vessel status, costs, and constraints


Solutions are often clear, but organizational alignment takes time


Lack of tools to evaluate trade-offs between options
"No time to do proper cost analysis... sometimes we just have to execute quickly"
"The most challenging part is waiting to hear back from other teams, which can take days"
“I need to check multiple applications just to understand where my vessels are"


Pain Points
Against the race of time to handle any schedule disruptions, below are the main difficulties that aggravate delays further for operators.


Brainstorm and Ideate
Early Sketches
As a team we sketched quick recovery flow mocks, different sequential UI options, and laid out actions that operators generally had to think about such as vessel speeds, port omits, and berthing windows. The plan was translate some of these ideas into concepts we could then test and validate with vessel operators in our next round of interviews.


User Flow
To ensure our designs aligned with real-world constraints and expectations, we created a comprehensive user flow diagram of the schedule recovery experience. This helped us:
Identify where users would input data (vessel, ports, schedule details)
Determine what backend data (AIS, port events, maps) we needed to pull and validate
Map out paths for error handling, corrections, and data cleanup when schedules were incomplete or malformed
Early Sketches
As a team we sketched quick recovery flow mocks, different sequential UI options, and laid out actions that operators generally had to think about such as vessel speeds, port omits, and berthing windows. The plan was translate some of these ideas into concepts we could then test and validate with vessel operators in our next round of interviews.
Brainstorm and Ideate


Early Wireframe Concepts
Before reaching final designs, we explored several early concept wireframes that aimed to fit our ideal vision of the full user flow. These initial layouts included multiple interaction patterns, filtering options, and varying levels of user input to validate what would work best for operators:
Full customization flows: Users could define every detail upfront for precise control.
Streamlined 2–3 step flows: A quicker approach that guided users through only essential inputs.
These explorations were intentionally broad because we knew the final MVP would require scoping down features to ensure speed and simplicity under real-world constraints. Testing these divergent approaches helped us identify which features were critical and which could be deferred for later releases.


MVP Wireframes
After some discussions with our engineering team and some quick feedback from some closeby stakeholders, we began scope down our concepts into a more feasible vision for the MVP. We aimed to focus on the following steps as the most important phases for MVP:
Setup Phase: Vessel selection and schedule import from operators
Optimization Phase: Automated calculation of scenario options
Exploration and Comparison Phase: Plan comparison view with detail cost breakdowns and designing for scannability to make quick decisions


Final Design
Based off some further testing with our wireframes, we honed down the final MVP design to support the following decisions.
Use existing design components to avoid increasing implementation time
Align with existing mental models in terms of navigation from other parts of the product
Minimize user input required to get to optimization results
Upon entry to the Schedule Recovery feature, operators would be presented a table list view of existing delays they've been working to resolve. This list view follows the paradigm of other features within the product and uses our existing table list component.
Vessel Selections and Schedule Upload
Once deciding to resolve a new delay, operators would be prompted to select a vessel and upload its corresponding schedule. The list of vessels would be ported through existing APIs or ported through data further given by our partners. The main goal here was to reduce any points of additional friction early on and to guide users to see "Recovery Options" for their vessel ASAP.


Recovery Options
Once the schedule is uploaded, operators would be shown Recovery Options for this specific vessel. The design mirrors the familiar noon report format that vessel operators use daily, displaying port stops in a linear sequence across the top row (left to right). Each row in the matrix represents a recovery scenario, showing:
Where recovery occurs (target port)
ETA progression across ports
When the vessel returns to schedule vs. when delays persist
Associated cost difference
By blending a timeline-based structure with scenario comparison, the table gives operators a quick, scannable way to understand trade-offs without switching between multiple tools or spreadsheets.


Key Legend and Expand
Looking down each recovery option row, the icons and colors represent:
In terms of actions, users can:
Add custom target ETAs in the top row for flexibility
Export recovery options to share across their org
Expand each plan to access detailed cost breakdown (fuel, EU ETS, CO₂ impact) and view any necessary speed changes


Schedule ETA
Vessel is on track to the original schedule ETA at this port


Schedule Speed
Vessel can follow the original schedule speed to stay on track


ETA Change
Vessel is no longer on track to reach this port at its original ETA


Speed Change
Vessel requires a speed change to recover to original schedule ETA


Target ETA
Vessel is on track to the target ETA inputted by user


Launch
The MVP was launched in Q4 and underwent targeted testing with four users from partner liner companies. Key validation outcomes:
User feedback highlighted the value of visual clarity and single-screen comparison of scenarios. One recurring request was to auto-fill known defaults for vessel characteristics to save even more time during urgent disruptions.
90%
TASK SUCCESS RATE
TASK SUCCESS RATE
Over 90 percent in MVP user tests, indicating the workflows were intuitive and efficient.
-20%
LOWER COSTS PER VOYAGE
LOWER COSTS PER VOYAGE
Initial usage showed a 20 percent decrease in voyage costs when optimized recovery plans were applied compared to traditional manual planning.
+10%
INCREASE IN SCHEDULE RELIABILITY
INCREASE IN SCHEDULE RELIABILITY
Early adoption led to a 10 percent increase in on-time performance, helping operators align closer to the 90 percent schedule reliability target.
Conclusion
The Schedule Recovery MVP demonstrated the value of designing for urgency and clarity under operational stress. By streamlining multi-variable decisions into an intuitive flow, we helped operators regain control in disruption scenarios that previously caused cascading delays and financial losses.
The early success of this feature has provided a foundation for Bearing AI to position itself as a proactive problem-solver for liner companies rather than a reactive feature builder.
Next Steps:
Port omission and cargo-cut capabilities: Enable operators to skip low-value ports or cut cargo to improve recovery outcomes.
Port API integrations for berth data: Automate the retrieval of live berthing windows to reduce manual coordination.
Predictive alerting for likely disruptions: Use machine learning to flag schedule risks before they occur.
Expansion into tramp and hybrid scheduling tools: Adapt recovery features for non-liner operations to broaden market reach.
Final Design
Based off some further testing with our wireframes, we honed down the final MVP design to support the following decisions.
Use existing design components to avoid increasing implementation time
Align with existing mental models in terms of navigation from other parts of the product
Minimize user input required to get to optimization results
Upon entry to the Schedule Recovery feature, operators would be presented a table list view of existing delays they've been working to resolve. This list view follows the paradigm of other features within the product and uses our existing table list component.


Vessel Selections and Schedule Upload
Once deciding to resolve a new delay, operators would be prompted to select a vessel and upload its corresponding schedule. The list of vessels would be ported through existing APIs or ported through data further given by our partners. The main goal here was to reduce any points of additional friction early on and to guide users to see "Recovery Options" for their vessel ASAP.
Based off some further testing with our wireframes, we honed down the final MVP design to support the following decisions.
Use existing design components to avoid increasing implementation time
Align with existing mental models in terms of navigation from other parts of the product
Minimize user input required to get to optimization results
Upon entry to the Schedule Recovery feature, operators would be presented a table list view of existing delays they've been working to resolve. This list view follows the paradigm of other features within the product and uses our existing table list component.
Final Design


Recovery Options
Once the schedule is uploaded, operators would be shown Recovery Options for this specific vessel. The design mirrors the familiar noon report format that vessel operators use daily, displaying port stops in a linear sequence across the top row (left to right). Each row in the matrix represents a recovery scenario, showing:
Where recovery occurs (target port)
ETA progression across ports
When the vessel returns to schedule vs. when delays persist
Associated cost difference
By blending a timeline-based structure with scenario comparison, the table gives operators a quick, scannable way to understand trade-offs without switching between multiple tools or spreadsheets.


Key Legend and Expand
Looking down each recovery option row, the icons and colors represent:

Schedule ETA
Vessel is on track to the original schedule ETA at this port

Schedule Speed
Vessel can follow the original schedule speed to stay on track

ETA Change
Vessel is no longer on track to reach this port at its original ETA

Speed Change
Vessel requires a speed change to recover to original schedule ETA

Target ETA
Vessel is on track to the target ETA inputted by user
In terms of actions, users can:
Add custom target ETAs in the top row for flexibility
Export recovery options to share across their org
Expand each plan to access detailed cost breakdown (fuel, EU ETS, CO₂ impact) and view any necessary speed changes


Launch
The MVP was launched in Q4 and underwent targeted testing with four users from partner liner companies. Key validation outcomes:
User feedback highlighted the value of visual clarity and single-screen comparison of scenarios. One recurring request was to auto-fill known defaults for vessel characteristics to save even more time during urgent disruptions.
90%
TASK SUCCESS RATE
TASK SUCCESS RATE
Over 90 percent in MVP user tests, indicating the workflows were intuitive and efficient.
-20%
LOWER COSTS PER VOYAGE
LOWER COSTS PER VOYAGE
Initial usage showed a 20 percent decrease in voyage costs when optimized recovery plans were applied compared to traditional manual planning.
+10%
INCREASE IN SCHEDULE RELIABILITY
INCREASE IN SCHEDULE RELIABILITY
Early adoption led to a 10 percent increase in on-time performance, helping operators align closer to the 90 percent schedule reliability target.
Conclusion
The Schedule Recovery MVP demonstrated the value of designing for urgency and clarity under operational stress. By streamlining multi-variable decisions into an intuitive flow, we helped operators regain control in disruption scenarios that previously caused cascading delays and financial losses.
The early success of this feature has provided a foundation for Bearing AI to position itself as a proactive problem-solver for liner companies rather than a reactive feature builder.
Next Steps:
Port omission and cargo-cut capabilities: Enable operators to skip low-value ports or cut cargo to improve recovery outcomes.
Port API integrations for berth data: Automate the retrieval of live berthing windows to reduce manual coordination.
Predictive alerting for likely disruptions: Use machine learning to flag schedule risks before they occur.
Expansion into tramp and hybrid scheduling tools: Adapt recovery features for non-liner operations to broaden market reach.
Say hello!
cbkim61@gmail.com
© 2025 Charles Kim
Made you look 👀
Say hello!
cbkim61@gmail.com
© 2025 Charles Kim
Made you look 👀
© 2025 Charles Kim
Made you look 👀
Say hello!